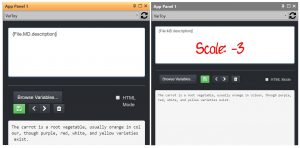
App

The App Panel at different scales

App Panel Scaling

IMatch apps are designed to be responsive and adapt to the current screen resolution. But sometimes this may not be enough, for example, when you want to use very small App Panels to maximize the screen estate available for other panels or the file window. Or when you use IMatch on a small tablet or notebook while on-location.

Scaling

Under Edit > Preferences > Application: User Interface you can control the global scale for information rendered in App Panels. You can reduce or increase the scale in 16 steps between -8 (smaller) and +8 (larger).

App Panel Scaling Control

Using the Apply button allows you to see the change in all open App Panels immediately. The App Panel on the left uses a scale factor of 0 (default). As you can see, the buttons in the panel need to wrap because the panel width is too small to display them in one row. By reducing the scale factor to -3, the data and control elements fit neatly in the available panel.

The App Panel at different scales

Summary

The global scaling for App Panels enables you to size the contents precisely to your requirements and liking.

See also the related article Configuring IMatch for High-DPI Screens and Easier Reading.

Gaining Insight with the Data Map App

A digital image management system should not only allow you to manage and find your files, it should also be able to provide additional insight about your files and the metadata associated with these files.

Did you ever wonder which of your folders occupies the most disk space? Which lens and ISO settings you use most often? How many files you took per location? Or the 50 most often keywords and which files have them?

All these questions can be answered and visualized using the Data Map App shipped with the digital asset management system IMatch. To use this App, open an App Panel in IMatch via View > Panels > App Panel (keyboard shortcut: <F9>,<1>) and then select Data Map App from the drop-down list at the top.

The 50 Most Often Used Keywords

In the screen shot below we see the Data Map App showing the 50 most frequently used keywords in a database:

Gaining insight by visualizing the 50 most often used keywords in your database.
Visualizing the 50 most often used keywords in your database.

This visualization uses the @Keyword category hierarchy for input and then calculates how often each keyword is used. In the resulting visualization, each colored box represents one of your keywords. The size of the box indicates how often the keyword is used – the larger the box, the more often the keyword is used.

To see all files with one of these keywords, just click on the box. IMatch switches to the Category View and selects the corresponding @Keyword category.

Visualizing ISO Usage

Another of the sample presets allows you to see the most frequently used ISO setting. The Top 50 ISO visualization is based on the a data-driven ISO sample category that is automatically created for new databases. By clicking any of the colored boxes you can open the corresponding category to see all images taken at that ISO setting.

Visualizing the most often used ISO settings for your images.

The Data Map App ships with a number of other pre-built visualizations, e.g., Top 50 folders (great to see what your largest folders are), lens usage statistics, the 50 top locations (based on the number of images taken) etc.

Extending IMatch with Apps

While being useful all by itself, the key point in the Data Map sample App is to demonstrate how you can extend IMatch with custom Apps. The unique IMatch 5 App technology makes it easy to add custom functionality to IMatch using only HTML and JavaScript.

This Data Map App uses the renowned open source D3JS visualization framework and combines it with a bit of custom JavaScript which loads data from an IMatch database and transforms it so it can be used as input by D3JS. Much more can be done with D3Js, check out their web site for examples.

Using an IMatch App written in HTML and JavaScript allows you not only to create your own Apps, but also to utilize all the awesome JavaScript libraries available today. These cover all kinds of topics: visualization, animated time lines, multimedia, presentation, slide shows, animations and much, much more.

If you know a bit about HTML and JavaScript (or you always wanted to learn these key technologies which drive the Internet) IMatch Apps are a useful and fun way to use these technologies.

Using the Copy Data App with Your Office Application


Exchanging data with other applications is one of the key features for an digital asset management system like IMatch.

If you want to transfer data from IMatch to your Office application, e.g., Microsoft® Excel, you can use the  Text Export Module to output the data to a file on disk. See the IMatch help on the Text Export module for detailed information.

An alternative is to use the neat Copy Data App. This App allows you to quickly copy arbitrary formatted data into the Windows clipboard and then you can insert it into your Office or other application. For this know-how article we use Microsoft Excel as the receiving application.

The Copy Data App in IMatch. Three files are selected in a File Window.
The Copy Data App in IMatch. This App comes pre-installed and with full source code.
(Click for a larger view)

Open an App Panel if none is visible: View menu > Panels > App Panel or press <F9>,<1>.

What to Copy?

The Copy Data App uses a mix of free text and IMatch variables to specify which data to copy. This makes it easy to produce exactly the format you want to use in your other application. The special [tab] token can be used to insert a tabulator character (09hex) and by pressing <Enter> you start a new line.

For this example, we want to copy the fully qualified file name, the file date in DD.MM.YYYY format, the XMP headline and the XMP description. Since we want to copy into Microsoft Excel, we separate each variable with a [tab]. This ensures that Excel automatically arranges the four values into separate columns.

We are using a free mix of text and variables to specify what to copy.

Copy the text from below into the Copy Data App input field if you want to try this yourself:

{File.FullName}[tab]{File.DateTime|format:DD.MM.YYYY}[tab]
{File.MD.XMP::photoshop\Headline\Headline\0}[tab]
{File.MD.XMP::dc\description\Description\0}

Copy the Data

When we now click on the Copy button in the App, IMatch copies the requested data for all selected files into the Windows clipboard. From there we can insert it into the receiving application.

The data in Microsoft Excel
The data in Microsoft Excel. Click for a larger view.