A digital image management system should not only allow you to manage and find your files, it should also be able to provide additional insight about your files and the metadata associated with these files.
Did you ever wonder which of your folders occupies the most disk space? Which lens and ISO settings you use most often? How many files you took per location? Or the 50 most often keywords and which files have them?
All these questions can be answered and visualized using the Data Map App shipped with the digital asset management system IMatch. To use this App, open an App Panel in IMatch via View > Panels > App Panel (keyboard shortcut: <F9>,<1>) and then select Data Map App from the drop-down list at the top.
The 50 Most Often Used Keywords
In the screen shot below we see the Data Map App showing the 50 most frequently used keywords in a database:
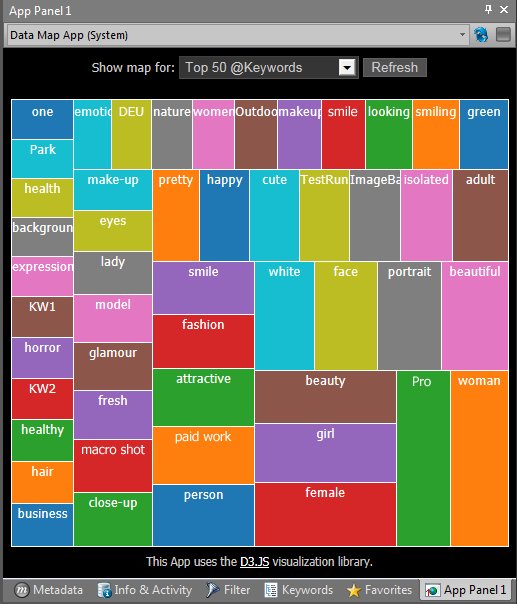
This visualization uses the @Keyword category hierarchy for input and then calculates how often each keyword is used. In the resulting visualization, each colored box represents one of your keywords. The size of the box indicates how often the keyword is used – the larger the box, the more often the keyword is used.
To see all files with one of these keywords, just click on the box. IMatch switches to the Category View and selects the corresponding @Keyword category.
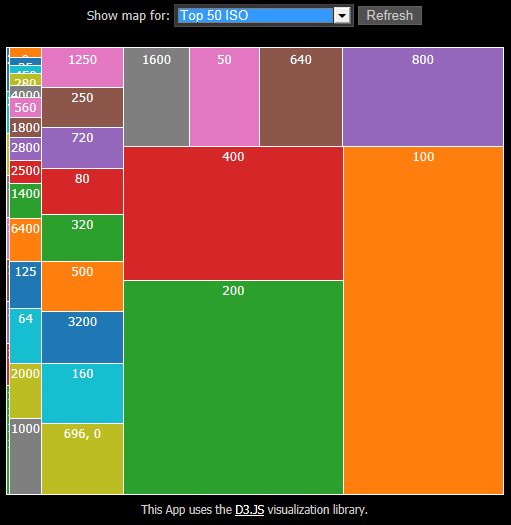
Visualizing ISO Usage
Another of the sample presets allows you to see the most frequently used ISO setting. The Top 50 ISO visualization is based on the a data-driven ISO sample category that is automatically created for new databases. By clicking any of the colored boxes you can open the corresponding category to see all images taken at that ISO setting.
The Data Map App ships with a number of other pre-built visualizations, e.g., Top 50 folders (great to see what your largest folders are), lens usage statistics, the 50 top locations (based on the number of images taken) etc.
Extending IMatch with Apps
While being useful all by itself, the key point in the Data Map sample App is to demonstrate how you can extend IMatch with custom Apps. The unique IMatch 5 App technology makes it easy to add custom functionality to IMatch using only HTML and JavaScript.
This Data Map App uses the renowned open source D3JS visualization framework and combines it with a bit of custom JavaScript which loads data from an IMatch database and transforms it so it can be used as input by D3JS. Much more can be done with D3Js, check out their web site for examples.
Using an IMatch App written in HTML and JavaScript allows you not only to create your own Apps, but also to utilize all the awesome JavaScript libraries available today. These cover all kinds of topics: visualization, animated time lines, multimedia, presentation, slide shows, animations and much, much more.
If you know a bit about HTML and JavaScript (or you always wanted to learn these key technologies which drive the Internet) IMatch Apps are a useful and fun way to use these technologies.